Your Nursing Salary Just Got Updated (New BLS Data). The State You Live In Matters Most.
The Bureau of Labor Statistics released its latest occupational wage data on May 15, and for nurses, the numbers tell a more complicated story than the headlines suggest.
Yes, wages are up. Yes, demand is growing. But where you work and where you live can swing your real purchasing power by more than $25 an hour. A nurse earning top dollar in California may be taking home less, in practical terms, than a nurse in Oklahoma making $20 less on paper.
Here is what the new data says for RNs, for NPs, and for nurses weighing the advanced practice path.
Registered nurses remain the largest healthcare practitioner occupation in the country, with roughly 3.38 million employed nationwide. The national mean annual wage for RNs reached $101,420 in 2025 according to the BLS Occupational Employment and Wage Statistics release. Most RNs, about 56%, work in general medical and surgical hospitals. After hospitals, the largest employers are physicians’ offices and home health care services.
Nurse practitioners numbered 323,040 nationally, with a mean annual wage of $137,300. NPs outnumber physician assistants, the third major advanced practice role tracked in this data, by roughly 2 to 1.

Wages rose across all three roles in 2025, but NPs and PAs outpaced RNs. Looking specifically at hospital industry wages, which run slightly higher than the cross-industry national mean, RN pay climbed 3.3% year over year from $101,100 to $104,420. NP hospital wages rose 4.3% to $144,760. PA wages grew 4.8% to $145,850. Hospital-based NPs and PAs now sit within $1,090 of each other annually, a convergence that reflects sustained acute care demand and, in many states, expanded NP scope of practice.
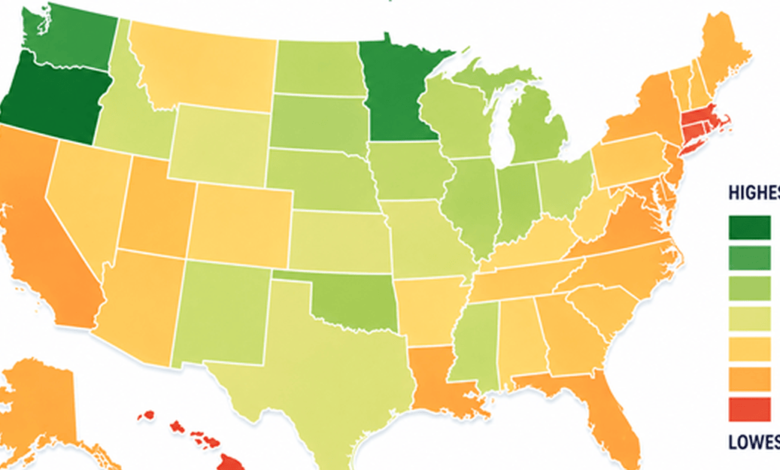
California has the highest nominal hourly wage for registered nurses at $72.25, per BLS state-level data. But nominal wages only tell half the story. Once you account for what it actually costs to live in each state, the rankings shift significantly.
Oregon leads the country for RNs on a cost-of-living adjusted basis at $52.95 per hour. Washington and Minnesota round out the top three. California, despite its $72.25 paycheck, adjusts down to $50.77, still in the top ten, but a different picture than the raw number suggests.
The starkest example is Hawaii. It ranks second in the country on nominal pay at $59.78 per hour. On a cost-of-living adjusted basis, it falls to last place nationally at $32.31, a cost of living adjustment of -$27.47 per hour.
Top 10 States for RN Pay, Adjusted for Cost of Living
| State | Nominal hourly wage | Cost-of-living adjusted hourly wage | Cost of living adjustment |
|---|---|---|---|
| Oregon | $59.20 | $52.95 | -$6.25 |
| Minnesota | $49.72 | $52.56 | +$2.84 |
| Washington | $58.43 | $51.21 | -$7.22 |
| Nevada | $50.82 | $50.72 | -$0.10 |
| California | $72.25 | $50.77 | -$21.48 |
| Michigan | $45.34 | $50.32 | +$4.98 |
| Texas | $45.86 | $49.79 | +$3.93 |
| Georgia | $45.71 | $49.42 | +$3.71 |
| New Mexico | $45.81 | $48.89 | +$3.08 |
| Indiana | $42.86 | $47.10 | +$4.24 |
Nominal wages: BLS Occupational Employment and Wage Statistics, May 2025. Cost of living index: World Population Review, 2025. Ranked by cost-of-living adjusted hourly wage.
A positive cost of living adjustment means the state’s lower cost of living is effectively adding to your purchasing power. A negative figure means cost of living is eating into your paycheck, and in some states, eating a lot of it.
Where RN Wages Are Growing Fastest
The absolute rankings matter, but so does momentum. Among states with comparable data from both the May 2024 and May 2025 BLS releases, West Virginia posted the largest year-over-year RN wage increase at 7.8%, rising from $80,650 to $86,970 annually. South Dakota followed at 6.8% and Nebraska at 6.6%. The median state-level RN wage increase was 3.4%.
At the other end, RN wages in the District of Columbia fell 2.1% and Oklahoma declined 0.9%. These figures reflect nominal wages and are not adjusted for cost of living.
>>Listen to The Latest Nurse News Podcast
The geography of NP pay looks different from RN pay, and the gap between nominal and adjusted is even more dramatic at the top end.
California again leads on nominal wages at $84.98 per hour, per BLS. But the cost of living adjustment drops that to $59.72, not even in the top ten on a cost-of-living adjusted basis. Oklahoma, with a nominal wage of $64.52, adjusts up to $75.02, the highest in the country. Iowa and New Mexico follow closely.
The pattern is consistent: states in the South and Midwest with low costs of living punch well above their nominal weight. States on the coasts look stronger on paper than they are in practice.
Top 10 States for NP Pay, Adjusted for Cost of Living
| State | Nominal hourly wage | Cost-of-living adjusted hourly wage | Cost of living adjustment |
|---|---|---|---|
| Oklahoma | $64.52 | $75.02 | +$10.50 |
| Iowa | $65.84 | $73.40 | +$7.56 |
| New Mexico | $68.99 | $73.63 | +$4.64 |
| Michigan | $63.84 | $70.85 | +$7.01 |
| Missouri | $62.97 | $70.75 | +$7.78 |
| Arkansas | $62.63 | $69.90 | +$7.27 |
| Kansas | $61.51 | $69.27 | +$7.76 |
| Minnesota | $65.33 | $69.06 | +$3.73 |
| Mississippi | $60.26 | $69.03 | +$8.77 |
| West Virginia | $60.95 | $69.03 | +$8.08 |
Nominal wages: BLS Occupational Employment and Wage Statistics, May 2025. Cost of living index: World Population Review, 2026. Ranked by cost-of-living adjusted hourly wage.
Hawaii tells the same story for NPs as it does for RNs. Its nominal wage of $68.71 per hour adjusts down to $37.14, the lowest in the country by a wide margin, a cost of living adjustment of -$31.57 per hour.
Where NP Wages Are Growing Fastest
Arkansas posted the largest year-over-year NP wage increase of any state with comparable data, rising 12.3% from $116,030 to $130,260 annually. New Jersey followed at 10.9%, climbing from $140,470 to $155,750, and South Carolina grew 9%. The median state-level NP wage increase was 4.2%, faster than the RN median of 3.4% and consistent with the stronger hospital-level wage growth NPs saw nationally.
NP wages were essentially flat in Kansas (less than 0.1% growth) and Indiana (0.1%).
The May 2025 BLS data covers all four major nursing roles, and looking at them together tells a cleaner story than any single role in isolation.
| Role | Employment | Mean hourly wage | Mean annual wage |
|---|---|---|---|
| Registered Nurses | 3,379,720 | $48.76 | $101,420 |
| Nurse Midwives | 7,920 | $65.86 | $136,980 |
| Nurse Practitioners | 323,040 | $66.01 | $137,300 |
| Nurse Anesthetists | 51,840 | $119.38 | $248,320 |
Source: BLS Occupational Employment and Wage Statistics, May 2025
The first thing that stands out is how closely NPs and CNMs track each other nationally, $137,300 versus $136,980, despite very different scopes of practice and career paths. Both represent roughly a $35,000 to $36,000 annual earnings premium over the RN mean.
The second thing that stands out is the CRNA figure. At a national mean of $248,320 per year, nurse anesthetists earn nearly two and a half times the RN mean. The 10th-to-90th percentile range runs from $155,250 to $339,500, meaning even lower-earning CRNAs out-earn the national RN average by a significant margin. The tradeoff is workforce size: with 51,840 employed nationally, it is a highly specialized and competitive path.
The gap between RNs and advanced practice roles is not evenly distributed across the country. In states where NP scope of practice is most expansive and demand is highest, the premium for advanced practice credentials tends to be larger. In states where NPs work under more restrictive collaborative practice agreements, the gap tends to be smaller.
The projected employment picture adds context for nurses weighing the advanced practice path. NP employment is projected to grow 40% between 2024 and 2034, the fastest growth rate of any healthcare occupation tracked by BLS. RN employment is projected to grow 5% over the same period, in line with the broader healthcare sector but well below the NP trajectory.
What This Data Does and Doesn’t Tell You
The BLS data is the most comprehensive wage survey in the country, but it measures what nurses are currently earning, not what any individual nurse will earn. Specialty, setting, years of experience, and shift differentials all affect take-home pay in ways the state-level averages don’t capture.
What the cost-of-living adjustment does is give you a more honest comparison across state lines. A nurse relocating from Indiana to California for a pay increase needs to know not just that California’s nominal wage is $72.25 versus Indiana’s $42.86, but that after adjusting for cost of living, the real purchasing power gap narrows considerably, from a nominal difference of $29.39 per hour to an adjusted difference of $3.67.
The rankings here are a starting point, not a verdict. But they’re a more useful starting point than the raw numbers alone.
🤔 Which matters more to you when choosing where to work: the paycheck or the purchasing power? Share your thoughts in the comments below.
If you have a nursing news story that deserves to be heard, we want to amplify it to our massive community of millions of nurses! Get your story in front of Nurse.org Editors now – click here to fill out our quick submission form today!
Primary data source: BLS Occupational Employment and Wage Statistics, May 2025 (released May 15, 2026, USDL-26-0725). Nominal wage figures verified directly against BLS state-level data. Cost-of-living index: World Population Review, 2025 (RN table) and 2026 (NP table). Year-over-year wage growth figures via Becker’s Hospital Review, which calculated state-level comparisons using May 2024 BLS data as baseline. Employment projections: BLS Employment Projections program, 2024-2034.
Nurse.org Analysis
-
Published on
May 19, 2026
Written by